Ponce-Davis · Market Report · Recorded Sales · Florida-licensed Español · Call (786) 550-6294
TheBuyerRebate.com Get started
Market report · October 2026 · Baseline edition

Ponce-Davis Real Estate Market Report

Closed Sales, Home Prices, Property Sizes & Current Inventory

Reporting period
October 9, 2025 – October 8, 2026 (12 months)
Last updated
· Methodology v1.1
Source
Recorded sales and property records, Miami-Dade County Property Appraiser
Scope
Our research area: SW 80th St to SW 88th St, SW 53rd Ave to Old Cutler Rd, unincorporated Miami-Dade. Not an official boundary.

Read the Ponce-Davis buyer guide →

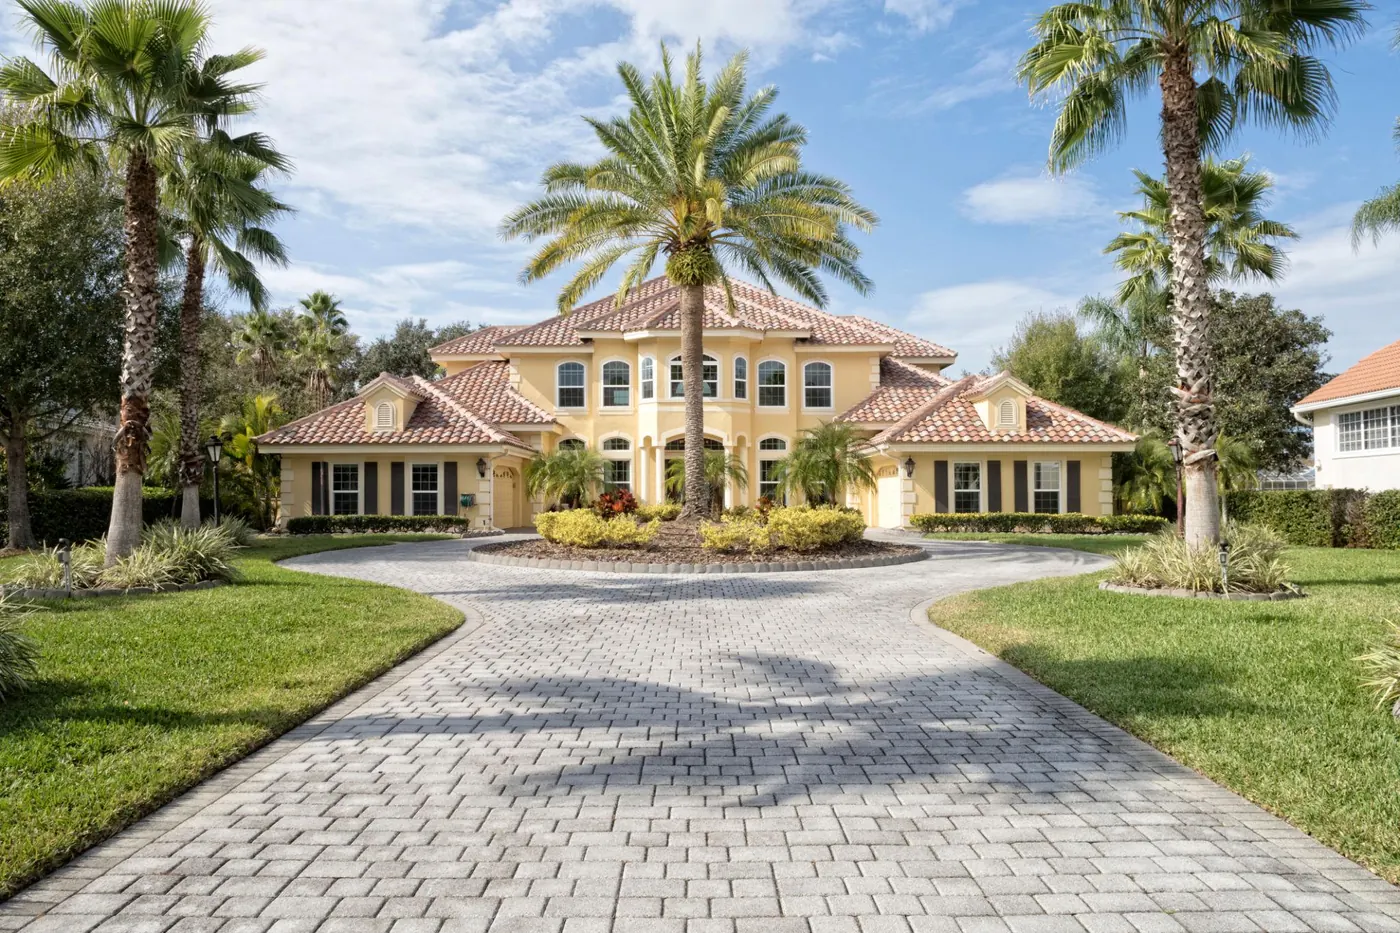
Two-storey Mediterranean-style estate with a terracotta tile roof, long paver driveway and palm-lined front lawn, representative of established luxury homes near Ponce-Davis
Representative photograph
Market snapshot

What sold in the last 12 months.

Closed sales · recorded deeds · Oct 9, 2025 – Oct 8, 2026

Closed sales
7
Qualified recorded sales
Median sold price
$13,104,000
7 sales
Average sold price
$12,740,571
7 sales
Total sales volume
$89,184,000
7 sales
Lowest sold price
$6,200,000
Built 1959 · 2,665 sq ft
Highest sold price
$19,500,000
New residence, not yet on the tax roll
Median living area
6,352 sq ft
5 sales with verified living area
Median lot size
41,818 sq ft
0.96 acre · 7 sales
Median price per living sq ft
$2,046
5 sales · range $1,178–$2,326

Listings · active and pending

Active listings
Not published this edition
Median asking price
Not published this edition
Asking and sold prices are never mixed
Pending sales
Not published this edition
Days on market · sale-to-list
Not published this edition
Listing data required

How these numbers are built. We count sales the Miami-Dade Property Appraiser records as qualified, by deed date. That excludes $0 and $100 transfers, such as corrective, quitclaim and family deeds. Each sale is checked by folio against our research area. Living area is the county’s heated-area figure. When county records are missing or conflict, that sale is left out of the size and price-per-square-foot figures; two sales are affected (notes 2 and 3). Sales closed in recent weeks may not yet be recorded. Methodology

Recent closed sales

All seven recorded sales, newest first.

Qualified recorded sales, Oct 9, 2025 – Oct 8, 2026. Source: Miami-Dade County Property Appraiser, retrieved Oct 8, 2026. Living area is the county heated area.
Deed datePropertySold priceLiving areaLot sizeYear built$ / living sq ft
May 21, 20264780 SW 86th Ter$15,000,0009,909 sq ft45,302 sq ft2016$1,514
Mar 27, 20265001 Pine Dr$13,500,000Conflicting241,818 sq ft2004—
Mar 13, 20268150 SW 52nd Ave$13,104,0006,352 sq ft42,900 sq ft2011$2,063
Mar 10, 20264763 SW 82nd St$12,230,0005,977 sq ft56,192 sq ft1995$2,046
Nov 3, 20255286 SW 80th St$9,650,0008,195 sq ft20,982 sq ft2025$1,178
Oct 17, 20255000 SW 82nd St$19,500,000Not yet on roll337,026 sq ftNot yet assigned3—
Oct 10, 20255100 SW 85th St4$6,200,0002,665 sq ft41,818 sq ft1959$2,326
  1. Prices are recorded deed prices. A recorded sale is not necessarily a listed or arm’s-length market sale. Public records do not show concessions, condition or what personal property was included.
  2. For 2025 and 2026 the county records 4,395 sq ft of heated area. The listing record reported a much larger living area. Until the conflict is resolved, this sale is excluded from living-area and price-per-square-foot figures.
  3. The 2026 tax roll still classifies this parcel as vacant residential land, with no living area or year built assigned. A newly built residence appears in the county’s building record but has not yet been valued, so this sale is excluded from living-area and price-per-square-foot figures.
  4. The county site address is shown. The property has also been marketed under a Pine Dr address.

Price alone doesn’t compare two sales. The highest price per square foot in the table bought a 1959 house on almost an acre. The lowest bought a new house on half an acre. Lot size, age and condition moved price as much as square footage did.

Price distribution

Where the sales happened.

Number of closed sales by sold-price range · Oct 9, 2025 – Oct 8, 2026 · 7 sales
Under $6M
0
$6M – $10M
2
$10M – $15M
3
$15M – $20M
2
Above $20M
0
Horizontal axis: number of sales (scale 0–3). Ranges include the lower bound: a $15,000,000 sale counts in $15M–$20M.

Five of seven sales closed between $12.2 million and $19.5 million. No recorded sale fell below $6 million or above $20 million in this window. That doesn’t mean homes at those prices don’t exist here; none was recorded in these 12 months.

Home sizes and lot sizes by price range

How much house does the money buy?

The same seven sales, grouped by price. With two or three sales per group, we show the actual values rather than medians.

Under $10 million · 2 sales

Sold prices
$6.2M · $9.65M
Living area
2,665 · 8,195 sq ft
Lot size
41,818 · 20,982 sq ft
Year built
1959 · 2025
$ / living sq ft
$2,326 · $1,178

These two sales are opposites. One was a 1959 house of 2,665 sq ft on almost an acre. The other was a new 8,195 sq ft house on half an acre. The older house had the highest price per square foot in the report, because most of what the buyer paid for was land.

$10M – $14.99M · 3 sales

Median sold price
$13,104,000
Living area
5,977 – 6,352 sq ft2
Lot size
41,818 – 56,192 sq ft
Year built
1995 – 2011
$ / living sq ft
$2,046 – $2,063

Established homes of about 6,000 sq ft on lots of roughly one acre or more. Two of the three have verified living area; their prices per square foot were $17 apart.

$15 million and above · 2 sales

Sold prices
$15.0M · $19.5M
Living area
9,909 sq ft · not yet on roll3
Lot size
45,302 · 37,026 sq ft
Year built
2016 · new, not yet assigned
$ / living sq ft
$1,514 · —

A 9,909 sq ft house built in 2016, and a newly built residence not yet valued by the county. Neither lot was larger than those in the $10–15M group, so the extra money above $15 million did not buy more land.

Active inventory

Not published in this edition.

Active and pending listing figures come from the MLS, not public records. The MLS data we hold is licensed for use with clients, not for public display. We will add an inventory snapshot, with its as-of date, once we have confirmed that aggregated listing statistics can be published.

If you are buying now, we can send you the current active and pending Ponce-Davis listings, with their history, as part of representing you.

Request current listings

Historical comparison

The previous 12 months, same method.

This is the baseline edition; future editions will update this page and compare with it. For reference, the same public-record rules applied to the prior 12 months give:

Qualified recorded sales of single-family and vacant residential parcels in the research area. Source: Miami-Dade County Property Appraiser, retrieved Oct 8, 2026.
PeriodSalesMedian sold pricePrice rangeVolume
Oct 9, 2024 – Oct 8, 202565$9,250,000$5.8M – $15.66M$60,358,200
Oct 9, 2025 – Oct 8, 20267$13,104,000$6.2M – $19.5M$89,184,000

5. Six sales of five properties: one home sold twice in the earlier period. One further sale is excluded because the county classifies it as a two-unit property, which falls outside the single-family rule used for both periods.

The median was higher in the later period, but that is not a measure of price change. With six or seven sales a year, the median depends on which homes sold. The later period included two sales above $15 million and more established homes on lots of about an acre. We don’t calculate a percentage change from samples this small.

What the sales tell us

Five things the recorded sales show.

  1. Most sales were above $12 million. Five of seven sold for $12.23M–$19.5M. The other two, at $6.2M and $9.65M, had either a much older house or a much smaller lot.
  2. Land sets the floor. The lowest price bought a 2,665 sq ft house from 1959 on 41,818 sq ft. At $2,326 per square foot, it was the most expensive sale in the sample per foot. For homes like this, price per square foot measures land, not house.
  3. Lot size separated similar homes. Six of seven sales were on lots of 37,026 sq ft or more. The exception, a new 8,195 sq ft home on 20,982 sq ft, sold for $9.65M. That is less than each of three older homes on lots of about an acre or more; two of those have verified living areas 1,800–2,200 sq ft smaller.
  4. Above $15M, the premium was not for land. The two sales over $15M were a 9,909 sq ft home built in 2016 and a newly built residence. Their lots were no larger than those in the $10–15M group.
  5. Small sample: handle with care. Seven sales is a thin base, and one sale can move the median. One additional reported closing could not be matched to a recorded deed and is excluded until it can be verified. These figures record what sold; they are not a valuation of any specific home.
Property-specific sales comparison

Considering a Ponce-Davis home? Request a property-specific sales comparison.

Send the address or listing link, or call. We compare the home against recorded sales and current listings with similar land, size and age. Eligible buyers receive up to 50% of our buyer-agent commission back at closing.

(786) 550-6294
  • Have a house or lot in mind? We pull the folio, the recorded sales history and the permit record before you write an offer.
  • Want the current listings? We send active and pending Ponce-Davis listings to the buyers we represent.

Methodology and sources

How this report is built.

Research area

SW 80th Street to SW 88th Street (N Kendall Drive), and SW 53rd Avenue to Old Cutler Road, unincorporated Miami-Dade parcels only. Parcels fronting a boundary road from the inside are included; parcels across those roads, and Coral Gables parcels east of Old Cutler Road, are excluded. This is our research area, not an official neighborhood, municipal or taxing-district boundary. Each sale is matched to its county folio and parcel location.

Which sales count

Included: sales the Property Appraiser classifies as qualified, of single-family or vacant residential parcels, with deed dates in the reporting period. The same rule applies to both periods. Excluded: corrective deeds, quitclaims, life-estate transfers and other $0 or $100 transfers, and two-unit or other property classes. Reported closings that don’t yet match a recorded deed are excluded and rechecked each edition.

Measures

Sold price is the recorded consideration. Living area is the county’s heated area, summed across buildings on the parcel. Price per square foot is calculated only where living area is verified, never from gross or total building area. Lot size is the county figure. Groups of three or fewer sales show actual values, not medians.

Sources

Miami-Dade County Property Appraiser: property records and sales history, by folio. Miami-Dade County Property Point View open data: parcel locations and sale dates. Both retrieved October 8, 2026. The county provides this data as-is, and the official records govern.

Edition: October 2026 (baseline) · Methodology v1.1. This report summarizes public records. It is not an appraisal or a valuation of any property.