Fisher Island · Market report · October 2026 · Florida-licensed Español · Call (786) 550-6294
TheBuyerRebate.com Get started
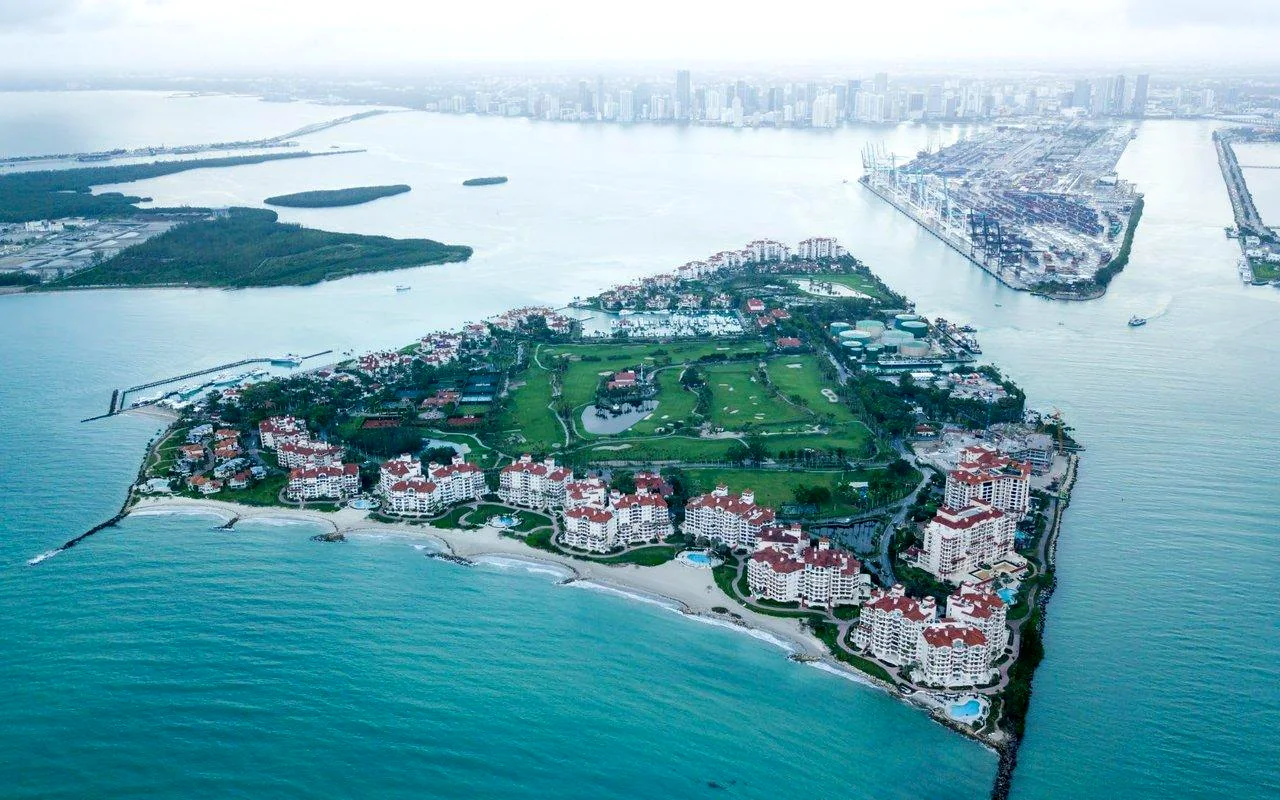
Aerial photograph of Fisher Island, Florida: the beachfront villages and golf course in the foreground, the marina and PortMiami beyond, and the Miami skyline across Biscayne Bay
Market report · October 2026 · Data as of October 12, 2026

Fisher Island Real Estate Market Report. October 2026.

21 condominium closings in twelve months, a $5,800,000 median and 24 resale listings. Every figure was checked record by record against the full MLS listing print before publication — and the sample is small enough that every number needs its context.

Eligible buyers receive up to 50% of our buyer-agent commission back at closing.

Read freely. Before you request a showing, register on a portal or contact a listing agent or sales gallery, talk to us first — the order can decide whether a rebate is still possible. Here’s why.

Jordan Real Estate 30+ years combined experience $1B+ closed
Fisher Island from the Atlantic side · photograph
Closed condo sales21closing dates Nov 5, 2025 – Oct 2, 2026
Median closed price$5,800,00021 condominium sales
Median price per sq ft$1,987median of each sale’s own figure
Resale listings24as of October 12, 2026 · asking, not sold
01Market snapshot

What closed on Fisher Island in the last twelve months.

Reporting periodClosings dated November 5, 2025 – October 2, 2026 — the 365 days ending October 12, 2026
Data snapshotOctober 12, 2026. MLS exports printed at 2:00 p.m. (closed sales) and 1:54 p.m. (active listings)
SourceSoutheast Florida MLS (Matrix) closed-sale and active-listing exports, verified line by line against the full listing print
ScopeFisher Island condominium units. One villa, one single-family sale and one new-construction listing are reported separately, not blended in

Closed condominium sales · MLS closing dates Nov 5, 2025 – Oct 2, 2026

Closed sales
21
Condominium units. The villa and the house in the same export are excluded
Median closed price
$5,800,000
21 sales
Average closed price
$9,845,619
Pulled up by two closings above $20,000,000
Total closed volume
$206,758,000
21 sales
Lowest · highest
$3,000,000 · $36,000,000
Seaside · Palazzo del Sol
Median living area
3,192 sq ft
MLS interior living area; terraces excluded
Median price per sq ft
$1,987
Median of 21 per-sale values · range $1,464–$4,018
Sold price vs. last asking
92.2%
Median; 2 of 21 closed at the full last asking price
Last 180 days
11 closings
$105,758,000 · median $7,400,000 · Apr 15 – Oct 12, 2026

Active resale supply · as of October 12, 2026

Resale listings
24
1 Six Fisher Island new-construction listing excluded · details
Median asking price
$12,900,000
Asking, not sold. A different set of residences from the 21 that closed
Asking range
$5,500,000 – $39,950,000
No resale listing under $5,000,000 on the snapshot date

How these numbers are built. We took the MLS closed-sales export for the 365 days ending October 12, 2026 and the active-listing export printed the same day, then checked every record against the full listing print: sale price, interior living area, status and closing date. All 23 closed records and 25 active records reconciled with no differences. Condominium statistics exclude one Seaside villa and one single-family house in Lindisfarne. Price per square foot is the median of each sale’s own figure, never total dollars divided by total area. Nothing on this page is an appraisal. Methodology

02Reading a small market

Twenty-one sales is a year of evidence, not a price index.

Fisher Island closes a few dozen condominium sales in a busy year, spread across buildings finished between 1986 and 2019 and across residences from under 2,000 to more than 9,000 square feet. Three habits keep the figures honest.

01

One sale moves the median

The $36,000,000 Palazzo del Sol closing alone was 17.4% of the year’s closed volume. Two closings above $20,000,000 lifted the average to $9,845,619 while the median stayed at $5,800,000. Quote the median — and say which buildings produced it.

02

Product mix, not price change

Sixteen of 21 closings were village-era residences in Bayside Village, Bayview, Oceanside and Seaside; 5 were Palazzo residences. A year with more Palazzo closings would show a higher median without a single residence changing value. We do not publish a year-over-year percentage from a sample this size.

03

Asking is not selling

The 24 resale listings are a different set of residences from the 21 that closed, weighted to Oceanside and the Palazzos. Their $12,900,000 median asking price says what owners are seeking, not what buyers paid. It is not evidence of a discount or of a premium.

Condominium closings by calendar quarter · 21 sales · first and last quarters are partial (window Oct 12, 2025 – Oct 12, 2026)
2025 Q4 (from Oct 12)
5
2026 Q1
4
2026 Q2
9
2026 Q3
2
2026 Q4 (to Oct 12)
1
Horizontal axis: number of closings (scale 0–9). Closings are placed by their MLS closing date.

Nine of the 21 closings fell in the second quarter of 2026. The summer and early fall were quiet, with three closings between July 1 and October 12, 2026. Seasonality is normal on the island, and a quiet quarter is not a trend.

03Closed sales breakdown

Where the 21 sales landed, by price.

Number of condominium closings by sold-price range · Nov 5, 2025 – Oct 2, 2026 · 21 sales
Under $5M
8
$5M – $10M
5
$10M – $20M
6
$20M and above
2
Horizontal axis: number of sales (scale 0–8). Ranges include the lower bound: a $5,000,000 sale counts in $5M–$10M.

Eight of the 21 closings were under $5,000,000 and eight were at or above $10,000,000; only 5 closed between $5,000,000 and $10,000,000. The 2 closings of $20,000,000 and above were both Palazzo del Sol residences and together carried 31.0% of the year’s closed dollar volume.

Closed condominium sales by price band
Price bandClosingsClosed volumeShare of volumeMedian $ / sq ftLiving areaYear built (MLS)Cash closings1
Under $5M8$29,945,50014.5%$1,6751,912–3,192 sq ft1986–19916 of 8
$5M – $10M5$32,100,00015.5%$2,7201,838–3,790 sq ft1986–19924 of 5
$10M – $20M6$80,712,50039.0%$2,8593,849–7,025 sq ft1991–20196 of 6
$20M and above2$64,000,00031.0%not published (2 sales)not publishednot published2 of 2
All condominium closings21$206,758,000100%$1,987median 3,192 sq ft1986–201918 of 21

Closed condominium sales by price band, MLS closing dates Nov 5, 2025 – Oct 2, 2026. Source: Southeast Florida MLS (Matrix) export of October 12, 2026, verified against the full listing print. Living area is MLS interior living area. Bands with fewer than three sales show counts and volume only.

  1. Closing dates, days on market, original asking prices and the financing field come from the full MLS listing print of each record; sale price, living area and year built were confirmed in both the single-line export and the print.
  2. Price per square foot is each sale’s price divided by its MLS interior living area. Terraces, lanais and garages are not included. Where a band holds fewer than three sales, its individual figures are not published.
  3. Individual sales are not listed by address or unit in this edition. A deed-level cross-check against Miami-Dade County public records is scheduled before any transaction is featured; the aggregate figures above do not depend on it.

Price and time to sell. Two sales closed at the full last asking price; 19 closed below it. The median sale closed at 92.2% of its last asking price and at 86.0% of its original asking price — seven of the 21 had reduced the price at least once before selling. Median days on market was 159; two sales were recorded with zero days on market. 18 of the 21 closings were recorded as cash.

04By building generation

Two markets share one island: the village-era communities and the Palazzos.

Fisher Island’s condominium stock splits into the low-rise villages built from the mid-1980s into the early 2000s and the three Palazzos completed between 2007 and 2019. In this year’s closings, that split explains more of the price range than square footage does.

Village-era communities

Bayside Village, Bayview, Oceanside and Seaside · 16 closings

Closed volume
$96,333,000 (46.6%)
Median closed price
$4,850,000
Price range
$3,000,000 – $12,700,000
Median $ / sq ft
$1,865
Median living area
2,382 sq ft
Year built (MLS)
1986–2002
Sold vs. last asking (median)
92.2%
Days on market (median)
172.5

The widest choice on the island and the source of 16 of the year’s 21 closings. Condition runs from original to fully renovated, which is why per-foot figures inside a single community can differ by hundreds of dollars — the village range this year was $1,464 to $3,379 per square foot.

Palazzo residences

Palazzo del Mare, Palazzo del Sol and Palazzo della Luna · 5 closings

Closed volume
$110,425,000 (53.4%)
Median closed price
$17,000,000
Price range
$14,425,000 – $36,000,000
Median $ / sq ft
$3,670
Median living area
7,025 sq ft
Year built (MLS)
2007–2019
Sold vs. last asking (median)
94.0%
Days on market (median)
13

Five closings carried more than half of the island’s closed dollar volume. This year’s Palazzo sales were all cash, large and comparatively quick — a median of 13 days on market against 172.5 for the villages — but five sales are too few to call a trend.

Closed condominium sales by community
CommunityClosingsMedian closed pricePrice rangeMedian $ / sq ftLiving areaYear built (MLS)Sold vs. last asking
Bayside Village7$3,800,000$3,216,000 – $5,350,000$1,6761,912–3,192 sq ft1986–198891.6%
Bayview4$6,600,000$3,600,000 – $11,350,000$1,8991,950–6,300 sq ft1990–199291.3%
Oceanside43$10,237,500$8,550,000 – $12,700,000$3,2082,530–3,959 sq ft1989–200295.1%
Palazzo del Sol / Palazzo della Luna54$22,500,000$15,000,000 – $36,000,000$3,7274,231–9,514 sq ft2016–201995.5%
Palazzo del Mare1not published (1 sale)———2007—
Seaside2not published (2 sales)———1989—

Closed condominium sales by community, MLS closing dates Nov 5, 2025 – Oct 2, 2026; communities are matched on the MLS subdivision field. Communities with fewer than three closings show counts only. Source: Southeast Florida MLS (Matrix), October 12, 2026.

  1. The MLS files Oceanside closings under subdivision names that include buildings with 1989, 2001 and 2002 year-built fields; all three are reported together here, as the MLS reports them.
  2. The MLS records Palazzo del Sol and Palazzo della Luna under one combined subdivision. Of the 4 closings, two carry a 2016 year-built field and two carry 2019. Separate medians are not published for two sales each.

Community descriptions, assessment structures and Club terms are covered in the Fisher Island buyer’s guide. The table above is a sales summary, not a ranking: a community with a lower median is not a lesser community, and a higher one is not a better investment.

05Active resale supply

Twenty-four resale listings, weighted to the newer and larger residences.

The active export of October 12, 2026 held 25 Fisher Island listings. One is Six Fisher Island, the developer’s new-construction project, and is excluded from every resale figure below. The remaining 24 are resale condominiums.

Resale listings
24
5 asking $5M–$10M · 13 asking $10M–$20M · 6 asking $20M and above
Median asking price
$12,900,000
Range $5,500,000 – $39,950,000
Median asking $ / sq ft
$3,021
Per-listing median; MLS interior living area
Months of supply
About 13.7
24 listings ÷ the past year’s pace of 1.75 closings a month · a rough gauge
Median time listed
200.5 days
Days on market of the 24 resale listings as of October 12, 2026
Six Fisher Island pricing
Not published here
Developer program · see the Six Fisher Island guide
Resale listings by community
CommunityListingsMedian asking priceAsking rangeMedian asking $ / sq ftYear built (MLS)
Palazzo del Sol / Palazzo della Luna9$14,750,000$12,200,000 – $39,950,000$3,7142016 · 2019
Oceanside67$12,900,000$7,800,000 – $28,900,000$3,0171989–2002
Bayview5$10,200,000$5,900,000 – $18,250,000$2,8961992–2004
Bayside Village2not published (2 listings)——1986
Palazzo del Mare1not published (1 listing)——2007

Resale listings by community as of October 12, 2026. Asking figures are what owners are seeking; they are not sale prices. Communities with fewer than three listings show counts only. Source: Southeast Florida MLS (Matrix) active export, verified against the full listing print.

  1. One active listing filed by the MLS under the Oceanside subdivision is marketed as Villa del Mare; it is counted with Oceanside here because the MLS counts it there.

Asking prices are not sale prices, and these are not the same residences. Seventeen of the 24 listings are Oceanside or Palazzo residences, while 16 of the 21 closings were village-era. We do not calculate a “discount” between the $12,900,000 asking median and the $5,800,000 closed median, and we would treat any such figure with suspicion. What the supply picture does say: a buyer looking at or above $10,000,000 had 19 resale choices on October 12, 2026; a buyer looking under $5,000,000 had none in the MLS that day.

06What the numbers mean for a buyer

Six takeaways for owner costs and due diligence.

  1. The island median is a village number. Sixteen of 21 closings were village-era residences, and the $5,800,000 median describes that stock. Price a Palazzo residence against Palazzo closings — $14,425,000 to $36,000,000 this year — not against the island median, and the reverse.
  2. Price per square foot ran from $1,464 to $4,018. Generation, exposure and condition drove that spread, not size. Before you compare any two residences, confirm whether a quoted area is MLS interior living area or includes terraces; the guide’s pricing section explains what else moves value here.
  3. Most buyers paid cash. Eighteen of 21 closings were recorded as cash. A financed buyer should expect the lender to review the condominium’s reserves, insurance and milestone-inspection status — and to approve how any rebate credit appears on the closing statement.
  4. Time and price reductions were normal. Median days on market was 159; the median sale closed at 92.2% of its last asking price and 86.0% of its original one, and seven sellers had reduced at least once. Patience and a documented comparable file are worth real money on this island.
  5. Carrying costs differ more than prices suggest. Two residences at the same price can carry very different condominium assessments, FICA charges and Club obligations; the lower-priced residence is not always the cheaper one to own. Request the budget, reserve study, milestone inspection report and Club terms early — the guide’s ownership-cost section lists the documents.
  6. Treat every figure as a sample. Twenty-one sales, five of them Palazzos, across a year. Nothing on this page is an appraisal or a valuation of a specific residence. When you have one in mind, we price it against closed sales for its building and line, not against an island average.
07Your rebate, estimated

What could you keep at Fisher Island prices?

Move the slider to your own price range. The starting figure is an illustration chosen for this page; this year’s closings ran from $3,000,000 to $36,000,000, with a median of $5,800,000.

Estimated rebateFisher Island residence
$6,000,000
Example buyer-agent commission$150,000
Illustrative rebate — up to $75,000

Illustration only — not a quote and not a guarantee. There is no standard commission: compensation varies by listing and by transaction, and not every purchase makes buyer-agent compensation available. Any rebate depends on the compensation actually received, your buyer-representation agreement, lender and settlement requirements, and applicable law. We confirm the figure in writing before you commit.

Considering Six Fisher Island? New-construction compensation is project-specific — read the Six Fisher Island guide before you register anywhere.

08How Jordan Real Estate represents Fisher Island buyers

Full representation first. The rebate is how we share the economics.

We are not a discount service. You receive complete, Florida-licensed buyer representation through closing, with the comparable file behind this report put to work on the residence you actually want.

Eligible buyers receive up to 50% of our buyer-agent commission back at closing. Whether a rebate exists on a particular purchase, and how much, depends on the buyer-broker compensation actually received by our brokerage, your written buyer-representation agreement, lender and settlement requirements, and applicable law. We confirm the figure in writing before you commit.

The order you do things in can decide whether you keep it. Request a showing, register on a portal, submit an inquiry form or contact a listing agent or sales gallery directly, and your inquiry may be routed to another agent — which can affect your representation options and potential rebate eligibility. Come to us first and you keep full representation and the possibility of a credit at closing when compensation is available. On Six Fisher Island, developer registration procedures make this especially important; our guide to developer broker-registration rules explains why.

What the first conversation covers

One conversation before you act — and what you leave it with.

Tell us which building, residence or listing you are looking at. In that first call we work through three things:

  1. Rebate eligibility review. The property, your representation status, whether buyer-agent compensation appears to be available and the estimated rebate that implies — confirmed in writing before you commit.
  2. Building-specific sales comparison. The closed sales for that building and line behind this report, the current listings around it, and what the spread between asking and sold prices has looked like there.
  3. Ownership-cost and strategy review. The condominium, FICA and Club charges that attach to that residence, the documents you need to evaluate them, and the negotiating and registration considerations that apply.
Check Your Rebate

A rebate is not guaranteed and is not automatic. It is subject to compensation actually received, your buyer-representation agreement, lender and settlement approval of credits, and applicable Florida rules. Read more in our Florida buyer rebate guide.

Building-specific sales comparison

Considering a Fisher Island residence? Request a building-specific sales comparison.

Send the building or listing link, or call. We compare the residence against closed sales for its building and line and the listings around it, then confirm in writing whether buyer-agent compensation appears to be available. Eligible buyers receive up to 50% of our buyer-agent commission back at closing.

(786) 550-6294
  • Have a residence in mind? We pull the closed sales for that building, the listing history and the association documents before you write an offer.
  • Want the detail behind this report? We send the transaction-level file, with its as-of date, to the buyers we represent.
  • Considering Six Fisher Island? Talk to us before you visit or register with the sales gallery; the order matters there.
  • Already contacted a listing agent, portal or sales office? Tell us exactly what happened and we will tell you honestly what is still possible.

10Methodology and sources

How this report is built.

Data source and snapshot

Two exports from the Southeast Florida MLS (Matrix) printed on October 12, 2026: a closed-sales export covering the 365 days ending that day (23 records) and an active-listing export (25 records). Each record was then checked against the full listing print of the same record for sale or asking price, interior living area, status and closing date. All 23 closed records and all 25 active records matched. A separate 180-day closed export (11 records) was reproduced exactly from the closing dates in the print.

Which sales count

Condominium units on Fisher Island with an MLS closing date in the period; the earliest closing in the export is dated November 5, 2025 and the latest October 2, 2026. One villa and one single-family sale in the same export are excluded from every condominium statistic. Sales that were not entered in the MLS, including private transfers, are not captured; the 21 closings are an MLS sample, not a count of every transfer on the island.

Measures

Sold price is the MLS closed price. Living area is the MLS interior living area field. Price per square foot is calculated for each sale and the median of those values is reported; it is never total dollars divided by total area. Sold-to-asking ratios divide the closed price by the last asking price and by the original asking price recorded in the listing print. Days on market and the financing field are taken from the print. Months of supply divides the resale listing count by the past year’s average monthly closings and is a rough gauge only. Medians are reported where a group has three or more records; smaller groups show counts.

Segmentation

Communities are matched on the MLS subdivision field as exported, with spelling variants grouped. The MLS combines Palazzo del Sol and Palazzo della Luna under one subdivision; the two are reported together, with their year-built fields noted. The MLS files several Oceanside buildings, built between 1989 and 2002, under Oceanside subdivision names; they are reported together. One active listing marketed as Villa del Mare is filed under Oceanside and counted there. Six Fisher Island, the island’s new-construction project, is excluded from resale figures.

What is not published, and why

Individual sales by address, unit or MLS number: a deed-level cross-check against Miami-Dade County public records is scheduled before any transaction is featured. Medians for groups of one or two records. Six Fisher Island asking prices, which follow the developer’s program rather than the resale market. Any “discount” between asking and closed medians, because the two samples are different residences. A year-over-year price change, because the sample is too small for one. A list-to-close analysis of our own transactions will be added when it has been verified to the same standard.

Source register
  • Southeast Florida MLS (Matrix) — closed sales, 365 daysSingle-line export of 23 records and the full listing print of the same records, printed October 12, 2026, 2:00 p.m.
  • Southeast Florida MLS (Matrix) — active listingsSingle-line export of 25 records and the full listing print of the same records, printed October 12, 2026, 1:54 p.m.
  • Southeast Florida MLS (Matrix) — closed sales, 180 daysExtract of 11 records, a subset of the 365-day set, reproduced from the closing dates in the print.
  • TheBuyerRebate.com reconciliation audit, October 13, 2026Record-by-record comparison of the exports against the listing print: price, interior living area, status and closing date. 23 of 23 closed and 25 of 25 active records matched.

MLS data is used in aggregate with the brokerage’s authorization. No listing photographs, remarks, agent information or report pages are reproduced on this page.

Edition: October 2026 (baseline) · Data as of October 12, 2026 · Methodology v1.0. This report summarizes MLS data verified record by record. It is not an appraisal or a valuation of any property, and a closed MLS sale is not necessarily an arm’s-length market sale.